Complex drawing of the monge. Monge method, multi-drawing Point projection, multi-drawing
Lecture
Subject "Engineering graphics"
Chapter. 1 Descriptive geometry
Compiled by: Shagvaleeva.G.N.
Introduction.
Descriptive geometry is also called the theory of images. The subject of descriptive geometry is the presentation and justification of methods for depicting spatial figures on a flat drawing and methods for solving spatial geometric problems on a flat drawing. Stereometric (three-dimensional) objects are discussed in it with the help of planimetric (two-dimensional) images of these objects, projections.
They say that drawing is the language of technology, and descriptive geometry is the grammar of this language. Descriptive geometry is the theoretical basis for the construction of technical drawings, which are complete graphic models of specific engineering products.
The rules for constructing images set forth in descriptive geometry are based on projection method.
The study of descriptive geometry contributes to the development of spatial representation and imagination, constructive geometric thinking, the development of abilities for analysis and synthesis of spatial forms and relationships between them. Mastering the methods of constructing various geometric spatial objects, methods of obtaining their drawings at the level of graphic models and the ability to solve problems on these drawings related to spatial objects and their geometric characteristics.
The foundation of descriptive geometry as a science was laid by the French scientist and engineer Gaspard Monge (1746-1818) in his work “Descriptive Geometry”, Paris, 1795. Gaspard Monge gave a general method for solving stereometric problems by geometric constructions on a plane, that is, in a drawing, with using drawing tools.
Accepted designations.
A, B, C, D, -points are indicated by capital letters of the Latin alphabet;
a, b, c, d - lines - in lowercase letters of the Latin alphabet;
p 1 - horizontal plane of projections,
p 2 - frontal plane of projections,
p 3 - profile plane of projections,
p 4 , p 5 , ... - additional projection planes.
planes
Projection axes - in lowercase letters of the Latin alphabet: x, y and z. The origin of coordinates is the number 0.
Projections of points, lines, planes are indicated: on p 1 with one stroke, on p 2 with two, on p 3 - with three strokes.
p 1 - A I , B I , C I ,..., a I , b I , ... , a I , b I ,
p 2 - A II, B II, C II,..., a II, b II, ..., a II, b II,
p 3 - A III, B III, C III,..., a III, b III, ..., a III, b III.
The formation of projections.
1 Center projection.
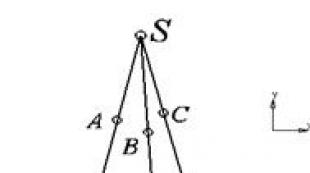
The central projection apparatus consists of the projection center S, projection plane π, projecting rays.

π 1 - projection plane
S - projection center
A, B, C - points in space
A", B", C" - projections of points onto the plane π"
Projection is the point of intersection of the projecting beam with the projection plane.
2. Parallel projection.
The projecting beams are conducted parallel to S and to each other. Parallel projections are divided into oblique and rectangular. With oblique projection, the rays are located at an angle to the projecting plane.

With rectangular projection, the projecting rays are perpendicular to the projection plane (Fig. 1.3). Rectangular projection is the main projection method adopted in the construction of technical drawings.

Basic properties of orthogonal projection
1. Projection of a point - there is a point;
2. Projection of a straight line (in the general case) - there is a straight line or point (the straight line is perpendicular to the projection plane);
3. If the point lies on a straight line, then the projection of this point will belong to the projection of the straight line: А l ® A "l";
4. If two lines in space are parallel, then their projections of the same name are also parallel: a || b ® a` || b`;
5. If two lines intersect at some point, then their projections of the same name intersect in the corresponding projection of this point: m ∩ n = K ® m" ∩ n" = K";
6. The proportionality of segments lying on one straight line or on two parallel lines is also preserved on their projections (Fig. 1.3): AB: CD \u003d A "B": C "D"
7. If one of the two mutually perpendicular lines is parallel to the projection plane, then the right angle is projected onto this plane by a right angle (Fig. 1.4).

Complex drawing of a point or Monge plots.
The most common method of descriptive geometry in practice was proposed by Gaspard Monge. This method is based on orthogonal design.
The orthogonal (or rectangular) projection of point A onto the plane π 1 is called the base of the perpendicular dropped from point A to the plane π 1 (Fig. 1.5)

The drawing obtained in this case on the plane π 1 is irreversible, the correspondence between the original A and the projection A "is unique only in one direction: from the original to the projection. The original corresponds to a single projection, the original drawing is uniquely defined, but for the projection A" there are countless originals corresponding to it , namely, all points of the projecting line AA". An exact translation from the language of the drawing into the language of nature is impossible. Therefore, Monge introduces a second projection plane.


Rice. 1.6. Fig.1. 7.
On fig. 6. shows a rectangular coordinate system.
Combining now the planes π 1 and π 2 with the projections built in them by turning π 1 around the X axis by 90 0 so that the front half-plane π 1 coincides with the lower half-plane π 2, we obtain complex point drawing or Monge diagram. (Fig. 1.7).
Built according to these rules a drawing consisting of a pair of projections located in a projection relationship is reversible, that is, the correspondence between the original and the drawing is unambiguous in both directions. Or in other words, the drawing gives comprehensive information about the original. Deciphering this information is the subject of descriptive geometry.
From the complex drawing of the point, we can draw the following conclusions:
1. two projections of a point completely determine the position of a point in space;
2. projections of points always lie on a connection line perpendicular to the projection axis.
The lines connecting the projections of the points are called communication lines and are depicted as solid thin lines.
In a number of constructions and when solving problems, it turns out to be necessary to introduce into the system π 1 (horizontal plane) π 2 (frontal plane) and other projection planes. The plane perpendicular to both π 1 and π 1 is the profile plane. π 3 . The line of intersection of the horizontal and frontal planes gives the X axis, the line of intersection of the horizontal and profile planes gives the Y axis, and the line of intersection of the frontal and profile planes gives the Z axis. (Fig. 1. 8)

To get a complex drawing of a point, it is necessary to place three planes in one, for which we “cut” the Y axis and combine the three main projection planes into one (Fig. 1. 9).

The third projection does not add any new information about the original. It only makes the available information more digestible. (Figure 1.10)

The distance from point A to the plane π 3 (A A "") in space can be seen in the drawing and it is equal to the distance A "AY \u003d A" A Z \u003d A X 0 \u003d X
The distance from point A to the plane π 2 (A A") in space can be seen in the drawing and it is equal to the distance A "AX \u003d A" "A Z \u003d A Y 0 \u003d Y
The distance from point A to the plane π 1 (A A") in space can be seen in the drawing and it is equal to the distance A "AX \u003d A" "A Y \u003d A Z 0 \u003d Z
Example. Build projections of points A(10, 10,30), B(30,20,10)

Competing points.
Points for which one pair of projections of the same name coincide (and others do not coincide) are called competing points.
The points are located on one projecting straight line, perpendicular to the frontal projection plane. The direction of view is indicated by an arrow. In this case, the projection B" is closer to the observer than A", and on π 2 the projection B"" will be visible and the projection A"" will be invisible (Fig. 1.12).

The concept of " higher lower»
The points are located on one projecting straight line, perpendicular to the horizontal projection plane. The direction of view is indicated by an arrow. In this case, the projection A "" is closer to the observer than B "", and on π 1 the projection A" will be visible and the projection B" will be invisible (Fig. 1.13).

Monge diagram or complex drawing is a drawing composed of two or more interconnected orthogonal projections of a geometric figure.
Using a spatial layout to display orthogonal projections of geometric figures is inconvenient due to its bulkiness, and also due to the fact that when it is transferred to a sheet of paper, the shape and size of the projected figure is distorted on the H and W planes.
Therefore, instead of the image in the drawing of the spatial layout, the Monge diagram is used.
The Monge diagram is obtained by transforming the spatial layout by combining the H and W planes with the frontal projection plane V:
- to align the H plane with V, rotate it 90 degrees around the x axis in the clockwise direction. In the figure, for clarity, the plane H rotated at an angle slightly less than 90 degrees, while the axis y, belonging to the horizontal projection plane, after rotation coincides with the axis z;
- after aligning the horizontal plane, rotate around the axis z also at an angle of 90 degrees to the profile plane in the direction opposite to the clockwise movement. At the same time, the axis y, belonging to the profile plane of the projection, after rotation coincides with the axis x.
After the transformation, the spatial layout will take the form shown in the figure. This figure also shows the sequence of the relative position of the floor of the projection planes, so the record V indicates that in this part of the Monge plot (limited by the positive direction of the axes x and z) closer to us is the upper left floor of the frontal projection plane V, behind it is the rear left floor of the horizontal projection plane H, followed by the upper rear floor of the profile plane W.
Since the planes have no boundaries, in the combined position (on the diagram) these boundaries are not shown, there is no need to leave inscriptions indicating the position of the floor of the projection planes. It is also superfluous to remind where the negative direction of the coordinate axes is. Then, in the final form, the Monge diagram replacing the spatial layout drawing will take the form shown in the figure. 
The Monge plot can be done with:
- conventional drawing tools and fixtures:
Drawing tools;
Drawing accessories and devices;
- Programs for building (drawing) the Monge diagram: Making a drawing in a graphics editor.
As an example of the design of the Monge diagram, we offer a solution to the problem of constructing an isosceles right triangle ABC: 
— the known by the condition of the problem is displayed in black;
- in green color all the constructions that lead to the solution of the problem are displayed;
- the searched tasks are displayed in red.
According to the condition of the problem, the projections of the triangle ABC(A`B`C`, A»B»…”) are given. To solve the problem, it is necessary to find the missing projection C.
Monge method, complex drawing.
Point projections, complex drawing.
Mutually perpendicular projection planes.
Methods of rectangular projection on two and three
Orthographic projection properties
Basic and unchangeable properties The (invariants) of orthogonal projection are the following:
1) point projection - point;
2) the projection of a straight line - in the general case, a straight line; if the direction of projection coincides with the direction of the straight line, then the projection of the latter is a point;
3) if a point belongs to a line, then the projection of this point belongs to the projection of the line.
4) projections of parallel lines are parallel to each other;
5) the ratio of line segments is equal to the ratio of their projections;
6) the ratio of segments of two parallel lines is equal to the ratio of their projections;
7) the projection of the point of intersection of two lines is the point of intersection of the projections of these lines;
8) if a straight or flat figure is parallel to the plane of projections, then they are projected onto this plane without distortion;
9) if at least one side of the right angle is parallel to the plane of projections, and the second is not perpendicular to it, then the right angle is projected onto this plane into a right angle.
If information about the distance of a point relative to the projection plane is given not with the help of a numerical mark, but with the help of the second projection of the point built on the second projection plane, then the drawing is called two-picture or comprehensive. The basic principles for constructing such drawings are set out Gaspard Monge - a major French geometer of the late 18th and early 19th centuries, 1789-1818. one of the founders of the famous Polytechnic School in Paris and a participant in the work on the introduction of the metric system of measures and weights.
The gradually accumulated separate rules and techniques of such images were brought into the system and developed in the work of G. Monge "Geometrie descriptive".
Monge's method of orthogonal projection onto two mutually perpendicular projection planes was and remains the main method for drawing up technical drawings.
In accordance with the method proposed by G. Monge, we consider two mutually perpendicular projection planes in space (Fig. 6). One of the projection planes P 1 placed horizontally, and the second P 2 - vertically. P 1 - horizontal projection plane, P 2 - frontal. The planes are infinite and opaque.
Projection planes divide space into four dihedral angles - quarters. Considering orthogonal projections, it is assumed that the observer is in the first quarter at an infinitely large distance from the projection planes.
| Figure 6. Spatial model of two projection planes | The line of intersection of the projection planes is usually called the coordinate axis and is denoted x 21 . Since these planes are opaque, only those geometric objects that are located within the same first quarter will be visible to the observer. To get a flat drawing consisting of the specified projections, the plane P 1 combine by rotation around the axis x 12 with flat P 2 (Fig. 6). A projection drawing, on which the projection planes with everything that is shown on them, combined in a certain way with one another, is commonly called Monge diagram(French Epure - drawing.) Or a complex drawing. |
Monge method, complex drawing. - concept and types. Classification and features of the category "Monge method, complex drawing." 2017, 2018.
The projection of a geometric object onto one plane, which we considered earlier, does not give a complete and unambiguous idea of the shape of a geometric object. Therefore, consider the projection of at least two mutually perpendicular planes (Fig. 1.2), one of which is located horizontally and the other vertically.
Despite the clarity, it is inconvenient to work with the drawing shown in Figure 1.2, because the horizontal plane on it is shown with distortion. It is more convenient to perform various constructions on the drawing, where the projection planes are located in the same plane, namely, the plane of the drawing. To do this, it is necessary to turn the horizontal plane around the OX axis by 90 ° and combine it with the front one so that the front floor of the horizontal plane goes down and the back one goes up. This method was proposed by G. Monge.
Rice. 1.2. Construction of the Monge diagram:
a) a spatial picture of the location of the projections of point A; b) a planar picture of the location of the projections of point A.
Therefore, a drawing obtained in this way (Fig. 1.2, b) is called a Monge diagram or a complex drawing.
Usually two projections are not enough to get a complete picture of the geometric object in question. Therefore, it is proposed to introduce a third projection plane, orthogonal to the first two (Fig. 1. 3, a).
Rice. 1.3. Construction of a three-picture complex drawing (monge diagram):
a) spatial model of projection planes; b) a three-picture complex drawing.
Then the plane P 1 called the horizontal projection plane, P 2- the frontal plane of projections (because it is located in front of us along the front), P 3- the profile plane of projections (located in profile with respect to the observer). Respectively A 1- horizontal projection of a point A, A 2- frontal projection of a point A, A 3- profile projection of a point A.
axes OH, OY, OZ are called projection axes. They are similar to the coordinate axes of the Cartesian coordinate system, with the only difference that the axis OH has a positive direction not to the right, but to the left. Now, in order to obtain projections in one plane (the plane of the drawing), it is also necessary to expand the profile plane of the projections to coincide with the frontal one. To do this, it must be rotated 90 ° around the axis oz, and turn the front half of the plane to the right, and the back to the left. As a result, we obtain a three-picture complex drawing (monge plots), shown in fig. 1.3, b. Since the axis OY unfolds together with two planes P 1 and P 3, then in the complex drawing it is depicted twice.
From this follows an important rule for the relationship of projections. Namely, based on Fig. 1.3, a, in mathematical form, it can be written as: A 1 A x \u003d OA y \u003d A z A 3. Therefore, in textual form, it sounds like this: the distance from the horizontal projection of the point to the axis OH is equal to the distance from the profile projection of the specified point to the axis OZ. Then, from any two projections of the point, you can construct a third one. Horizontal and frontal projections of a point A connects the vertical line of communication, and the frontal and profile projections - horizontal.
Due to the fact that a complex drawing is a model of space folded in a plane, a projected point cannot be depicted on it (except when its position coincides with one of the projections). Based on this, it should be borne in mind that in a complex drawing we operate not with the geometric objects themselves, but with their projections.
The projection of a geometric object onto one plane, which we considered earlier, does not give a complete and unambiguous idea of the shape of a geometric object. Therefore, consider the projection of at least two mutually perpendicular planes (Fig. 1.2), one of which is located horizontally and the other vertically.
Despite the clarity, it is inconvenient to work with the drawing shown in Figure 1.2, because the horizontal plane on it is shown with distortion. It is more convenient to perform various constructions on the drawing, where the projection planes are located in the same plane, namely, the plane of the drawing. To do this, it is necessary to turn the horizontal plane around the OX axis by 90 and combine it with the front one so that the front floor of the horizontal plane goes down and the back one goes up. This method was proposed by G. Monge.
Rice. 1.2. Construction of the Monge diagram:
a) a spatial picture of the location of the projections of point A; b) a planar picture of the location of the projections of point A.
Therefore, a drawing obtained in this way (Fig. 1.2, b) is called a Monge diagram or a complex drawing.
Usually two projections are not enough to get a complete picture of the geometric object in question. Therefore, it is proposed to introduce a third projection plane, orthogonal to the first two (Fig. 1. 3, a).

Rice. 1.3. Construction of a three-picture complex drawing (monge diagram):
a) spatial model of projection planes; b) a three-picture complex drawing.
Then the plane P 1 called the horizontal projection plane, P 2 - the frontal plane of projections (because it is located in front of us along the front), P 3 - the profile plane of projections (located in profile with respect to the observer). Respectively A 1 - horizontal projection of a point A, A 2 - frontal projection of a point A, A 3 - profile projection of a point A.
axes oh, ohY, oz are called projection axes. They are similar to the coordinate axes of the Cartesian coordinate system, with the only difference that the axis OH has a positive direction not to the right, but to the left. Now, in order to obtain projections in one plane (the plane of the drawing), it is also necessary to expand the profile plane of the projections to coincide with the frontal one. To do this, it must be rotated 90 around the axis oz, and turn the front half of the plane to the right, and the back to the left. As a result, we obtain a three-picture complex drawing (monge plots), shown in fig. 1.3, b. Since the axis OY unfolds together with two planes P 1 and P 3 , then in the complex drawing it is depicted twice.
From this follows an important rule for the relationship of projections. Namely, based on Fig. 1.3, a, in mathematical form, it can be written as: A 1 A x = OA y = A z A 3 . Therefore, in textual form, it sounds like this: the distance from the horizontal projection of the point to the axis OH is equal to the distance from the profile projection of the specified point to the axis OZ. Then, from any two projections of the point, you can construct a third one. Horizontal and frontal projections of a point A connects the vertical line of communication, and the frontal and profile projections - horizontal.
Due to the fact that a complex drawing is a model of space folded in a plane, a projected point cannot be depicted on it (except when its position coincides with one of the projections). Based on this, it should be borne in mind that in a complex drawing we operate not with the geometric objects themselves, but with their projections.