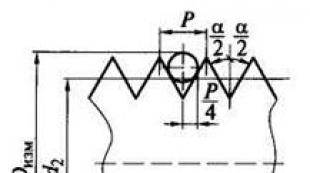
What is the critical moment of statistical observation. The main stages of statistical observation. Forms, types and methods of statistical observation. Methods for obtaining statistical information
This is a preliminary stage of statistical research, which is a systematic, scientifically organized accounting (collection) of primary statistical data on mass socio-economic phenomena and processes.
Not every collection of data can be called a statistical observation. Observation will be statistical, firstly, when it is accompanied by the registration of the studied facts in the relevant accounting documents for their further generalization, and secondly, when it is of a mass nature. This provides coverage of a significant number of cases of manifestation of a particular process, necessary and sufficient in order to obtain data that concern not only individual units of the population, but the entire population as a whole.
Statistical observation must meet a number of important requirements:
a) be carried out continuously and systematically;
b) the accounting of mass data should be such that not only the completeness of the data is ensured, but also their constant change is taken into account;
c) the data must be as reliable and accurate as possible;
d) the studied phenomena should have not only scientific, but also practical value.
The collection of statistical data can be carried out both by state statistics bodies, research institutes, other government agencies, and by the economic services of banks, stock exchanges, enterprises, and firms. Only in this case, researchers receive reliable and sufficiently diverse statistical information that allows them to comprehensively study socio-economic phenomena.
Stages, forms, types and methods of statistical observation
Statistical observation (collection of primary statistical material) consists of three main stages:
preparation of statistical observation;
organization and production of observation;
control of the obtained primary data.
On the preparation stage statistical observation, the goal is determined, the object and unit of observation are established, tools and an observation program are developed. General purpose of statistical observation is to obtain reliable information about the trends in the development of phenomena and processes for the subsequent adoption of managerial decisions. It must be specific and clear. A vague goal can lead to the collection of the wrong data that is necessary to solve a specific problem.
The goal determines the object of statistical observation. Object of observation there is some studied statistical population of either individuals (population, employees), or legal entities (enterprises, firms, educational institutions), or physical units (production equipment, vehicles and transportation, residential buildings), i.e. the studied statistical population consists of separate units.
This is the primary element of the object of statistical observation, which is the carrier of signs to be registered. Indication of the most important features allows you to establish study population boundaries. For example, if it is necessary to conduct a study of the profitability of printing enterprises, then it is necessary to determine the forms of ownership of these enterprises, the organizational and legal framework, the number of employees of the enterprise, the volume of sales of products, i.e. something that distinguishes both state and non-state enterprises, as well as small and large enterprises. Only in this case we will get reliable statistical information.
The unit of observation should be distinguished from the reporting unit. A reporting unit is a unit from which reporting data is received. It may or may not match the unit of observation.
The rationale for the goal, the choice of observation units, reporting units, the selection of essential features, the period of time for statistical observation, reporting forms are set out in the program of statistical observation. Usually monitoring program call the list of questions that are subject to registration during the observation. In order for the observation program to be scientifically substantiated and correctly drawn up, the following requirements are imposed on it:
a clear and specific statement of the main goal of observation;
determination of the place and time of observation, where the critical moment (date or time interval, as of which the registration of signs is carried out) and the period (period of filling out the statistical form) are determined;
selection of a number of the most significant features of the object of observation;
a comprehensive definition of the type, main features and properties of the phenomenon under study;
questions formulated in the program should not be ambiguous;
compliance with the logical principle of the sequence of questions;
inclusion in the program of questions of a control nature to check the collected statistical data;
combination of closed and open questions of the program.
The program is drawn up in the form of a document, the so-called statistical form, which ensures the uniformity of the information received from each reporting unit. The form has a title part (information about those who conduct the observation) and an address part (address and subordination of the reporting unit). The program has an application - instructions ( statistical observation tools), which determines the procedure for conducting the observation and the procedure for filling out the reporting form.
At the second stage, the most important organizational issues of statistical observation are solved. They consist in choosing organizational forms of observation, types of observation and methods of obtaining statistical information that correspond to the goals and objectives of a particular statistical observation.
The whole variety of forms, types and methods of observation can be represented as follows.
According to the form of organization of statistical observation: reporting; specially organized statistical survey - census; registers.
By types of statistical observation: a) by the time of registration of facts (current or continuous; discontinuous - periodic, one-time); b) by coverage of population units (continuous; non-continuous - the main array, selective, monographic).
According to the methods of obtaining statistical information: direct observation; documentary way; survey - forwarding, questionnaire, attendance, correspondent, self-registration.
The main form of statistical observation is reporting. If the primary account ( primary accounting document) registers various facts, then reporting is a generalization of primary accounting.
An official document, which is certified by the signatures of persons responsible for the provision and reliability of the collected information, and approved by the state statistics authorities. In addition to the annual, there may be daily, weekly, biweekly, monthly and quarterly reporting. Reporting can be submitted by mail, telegraph, teletype, fax.
A census can be attributed to a specially organized statistical observation. In practice, a census of the population, material resources, green spaces, unfinished construction projects, equipment, etc. is carried out.
Observation, repeated at regular intervals, the task of which is not only to determine the size and composition of the population under study, but also to analyze quantitative changes between two surveys. Of all the censuses, the population censuses are the best known.
A form of continuous statistical observation is register observation(register), whose objects are long-term processes that have a fixed start, stage of development and a fixed end time. The register is based on a system for tracking the status of variables and fixed indicators. In statistical practice, there are population registers and business registers. Currently, in Russia there is a Unified State Register of Enterprises of All Forms of Ownership (EGRPO), the information fund of which contains: a register code, information on territorial and industry affiliation, form of subordination, type of ownership, reference information and economic indicators (average number of employees; funds, allocated for consumption; residual value of fixed assets; balance sheet profit or loss; statutory fund). When the enterprise is closed, the liquidation commission informs the register maintenance service about it within ten days.
Let us briefly consider the types of statistical observation by the time of registration of facts. Continuous (current) statistical observation- this is a systematic registration of facts or phenomena as they become available in order to study their dynamics. For example, civil registration (births, marriages, deaths), registration by insurance companies of all accidents and other adverse events as they occur.
species discontinuous observation are one-time and periodic. The first is a one-time continuous observation for collecting quantitative characteristics of a phenomenon or process at the time of its study. Periodic observation is carried out at certain intervals according to a similar program and tools. For example, a periodic study of passenger traffic in public transport, periodic registration of producer prices for individual goods (once a month or a quarter).
According to the coverage of population units, statistical observation can be continuous and non-continuous. Continuous observation covers all units of the target population (for example, a general population census). In turn, discontinuous observation covers only part of the study population. Depending on how this part is chosen, non-continuous observation can be divided into selective (based on the principle of random selection), the main array method (the most significant or largest units of the studied population are examined) and the so-called monographic observation (a detailed study of individual units of the studied population to identify emerging trends).
As for the methods of obtaining statistical information (methods of statistical observation), there are three main methods: direct observation, documentary observation and survey.
A fairly reliable source of data is direct observation when it is possible to establish a fact subject to registration. But this method requires significant labor costs and the presence of all necessary conditions. It is most often used in monitoring the commissioning of construction projects.
Another reliable method is documentary, based on the use of various accounting documents (invoices, complaints, etc.) as a source of information and contributing to obtaining accurate information.
The method of observation, in which the source of information is the words of the respondents, is called polling. Its varieties: oral (expeditionary), questionnaire, correspondent, face-to-face survey and self-registration.
Oral questioning can be either direct (direct communication of the counter with the respondent) or indirect (for example, by telephone).
At questionnaire method a certain number of respondents receive special questionnaires, either in person or through print media. This type of survey is used in studies where indicative results are needed that do not claim high accuracy (study of public opinion).
The secret method is used in continuous observation when personal presence is necessary (registration of marriages, divorces, births, etc.).
At correspondent way information is provided by a staff of voluntary correspondents, due to which the material received is not always of a qualitative nature.
Finally, at self-registration method the forms are completed by the respondents themselves, and the enumerators consult and collect the forms. In statistical practice, different types of statistical observations can be combined, complementing each other.
At the third stage, the collected statistical material must pass the control. As practice shows, even with well-organized statistical observation, there are errors and errors that require correction. Therefore, the purpose of this stage is both counting and logical control of the obtained primary data. The discrepancy between the calculated and actual values of the investigated quantity in statistics is called the error of observation. Depending on the causes of occurrence, registration errors and representativeness errors are distinguished.
Counting control is used to detect errors, especially to check the totals. In addition to counting, logical control is also used, which may cast doubt on the correctness of the data obtained, since it is based on a logical relationship between features. For example, in a population census, the fact that a five-year-old child has a secondary education is called into question, and in this case it is clear that an error was made when filling out the form.
If registration errors are characteristic of any observation (continuous and non-continuous), then representativeness errors- just random observation. They characterize the discrepancies between the values of the indicator obtained in the surveyed population and its value in the original (general) population. Representativeness errors can also be random or systematic. Random errors occur if the selected population does not fully reproduce all the features of the general population, and the magnitude of these errors can be estimated. Systematic representativeness errors can occur if the very principle of selecting units from the initial population is violated. In this case, the completeness of the collected data is checked, the accuracy of the information is arithmetic checked for its reliability, and the logical relationship of the indicators is checked.
The statistical observation is completed with a control check of the collected data.
Statistical observation
2.1 The concept of statistical observation, the stages of its implementation.
2.2 Basic organizational forms of statistical observation. Types and methods of statistical observation.
2.3 Program and methodological issues of statistical observation.
2.4 Organizational issues of statistical observation.
2.5 Errors of statistical observation.
The concept of statistical observation, the stages of its implementation
Statistical observation- this is a mass, systematic, scientifically organized observation of the phenomena of social and economic life, which consists in registering selected features for each unit of the population.
Not every collection of information is a statistical observation. Only such an observation can be called statistical, which ensures the registration of the established facts in accounting documents for subsequent generalization.
An example of statistical observation would be the systematic recording of production costs or public opinion surveys to identify people's attitudes towards issues or events of interest.
Statistical observation can be carried out by state statistics bodies, research institutes, economic services of banks, stock exchanges, firms.
The process of statistical observation includes the following steps:
1) preparation of observation;
2) conducting mass data collection;
3) preparation of data for automated work;
4) development of proposals for improving statistical observation.
The first stage includes:
Determining the purpose and object of observation, the composition of signs to be registered;
Development of documents for data collection;
Choice of reporting unit, methods and means of obtaining data, etc.
The second stage includes work on filling in statistical forms.
At the third stage, the collected data is subjected to arithmetic and logical control.
At the fourth stage, it is produced:
Analysis of the reasons that led to the incorrect filling of statistical forms;
Development of proposals for improving surveillance.
2.2 Basic organizational forms of statistical observation.
Types and methods of statistical observation
Statistical observation is carried out in 2 forms:
1) by reporting;
2) by conducting specially organized statistical observations.
Reporting is an organized form of statistical observation, in which information is received in the form of mandatory reports on time and in approved forms.
Reporting as a form of statistical observation is based on primary accounting and is its generalization.
Primary accounting is a registration of various facts (events, processes, etc.) produced as they are completed and, as a rule, on the primary document.
The management of statistical reporting and its organization are entrusted to the bodies of state statistics. All forms of statistical reporting are approved by state statistics bodies. Submission of reports in unapproved forms is considered as a violation of reporting discipline, for which the heads of enterprises and departments are responsible.
Methods and forms of organization of statistical reporting are differentiated in relation to different types of enterprises and forms of entrepreneurship.
According to the period of time for which reporting is submitted, according to its duration, current and annual reporting are distinguished. If information is presented for the year, then such reporting is called annual. Reporting for all other periods within less than a year, respectively, quarterly, monthly, weekly, etc. called current.
Specially organized statistical observation- a collection of information through censuses, one-time records and surveys. For example: population census, census of equipment, remnants of materials, etc.
Types of statistical observation
Types of statistical observation differ in the time of data registration and in the degree of coverage of units of the study population.
According to the time of data recording, there are:
Continuous (current) surveillance;
Discontinuous (periodic) observation.
Intermittent surveillance is divided into:
periodic;
One-time.
Current (continuous) is a systematic observation. In this case, the registration of facts is carried out as they are completed. For example, registration of acts of civil status. With current observation, one should not allow a significant gap between the moment of occurrence of a fact and the moment of its registration.
Discontinuous (periodic) called an observation that repeats itself at regular intervals. For example, annual livestock censuses conducted as of January 1st.
One-time (one-time) observation carried out as needed, from time to time, without observing a strict frequency, or even once. For example, studying the opinions of buyers about the quality of goods.
According to the degree of coverage, the following types of statistical observation are distinguished:
solid;
Discontinuous.
continuous called such an observation in which all units of the studied population, without exception, are subjected to examination. For example, the All-Russian population census of 2010. Through continuous observation, reports are received from enterprises and institutions.
discontinuous called such an observation in which pre-established units of the statistical population are surveyed. For example, the study of trade turnover and prices in city markets. The main advantage of this observation is to increase the efficiency of collecting statistical material.
Depending on the task of the study and the nature of the object, non-continuous observation can be:
Selective;
By the main array method;
Monographic.
Selective An observation is called an observation in which the characteristics of the entire set of facts are given according to some part of them, selected in a random order. It is widely used in various sectors of the national economy: in industry - to control the quality of products; in trade - to study the demand of the population, etc.
Main Array Method consists in the fact that that part of the units of the population is subjected to examination, in which the value of the studied trait is predominant in the entire volume. Thus, monitoring of the work of city markets was organized. Of all the cities for observation, 308 cities were selected, which are the largest industrial and cultural centers, in which more than 50% of the total urban population lives. The turnover of markets in these cities is over 60% of the total turnover of market trade.
Monographic survey- this is a detailed, in-depth study and description of individual units of the population, characteristic in any respect. It is carried out in order to identify existing or emerging trends in the development of this phenomenon.
Similar information.
Purpose: to form knowledge about the sources of statistical information, data collection methodology that meets international standards for the quality of statistical observation data.
Tasks: to consider program and methodological issues of statistical observation.
Sources of statistical information. The essence of statistical observation
Statistical information is the most important information resource of society.
Statistical data are published in special collections and reference books published in the system of state statistics, in industry and departmental information and analytical publications, scientific journals, periodicals, and on Internet sites.
In the system of state statistics, the main annual statistical publications (publishing house Rosstat) include:
Russian Statistical Yearbook;
Russia in numbers;
Regions of Russia;
Russia and countries of the world;
A number of thematic statistical collections, such as “Industry in Russia”, “Finances of Russia”, “Demographic Yearbook of Russia”, etc. Quarterly, Rosstat publishes the journal “Statistical Review”, monthly - a brief report “The Socio-Economic Situation in Russia” and scientific information journal “Questions of Statistics”. The most important socio-economic indicators of the Russian Federation are presented on the Internet on the official website of Rosstat.
If there are no relevant data in the statistical collections, then a statistical study should be carried out. The collection of primary statistical information necessary for conducting a statistical study is carried out with the help of statistical observation. This is the first stage of the research. The quality of its conclusions and recommendations depends on the quality of its organization and conduct.
Statistical observation is a systematic scientifically organized collection of data on mass phenomena and processes.
Statistical observation is carried out in three stages:
1. preparation of observation;
2. direct collection of primary data;
3. control of the collected information.
The observation must have scientific or practical value.
Data (facts) collected as a result of statistical observation must meet the following requirements:
1. The data must be reliable.
2. The completeness of the facts relating to the matter under consideration must be ensured.
3. It is necessary to ensure the comparability of data.
4. Data must be timely. Late information is practically unnecessary.
The preparation of observation involves the solution of a number of questions.
Statistical observation plan, its program-methodological and organizational issues
Statistical observation is prepared and carried out according to the developed plan, which is included in the plan of the entire statistical study and includes program-methodological and organizational issues.
Program and methodological issues:
Determination of the purpose and tasks of observation;
Definition of the object and unit of observation;
Development of a monitoring program;
Designing forms and texts of instructions;
Establishment of sources and methods of data collection, form and type of observation.
Conducting statistical observation begins with the formulation of the purpose of the survey. Purpose of the survey- a description of the information that they want to receive during the observation. Depending on the goal, specific monitoring tasks are set. For instance:
The purpose of the survey is to determine the characteristics of changes in consumer expectations of various groups of the Russian population.
Survey tasks:
Studying the opinion of the population on the dynamics of the general economic situation;
Studying the opinion of the population on the dynamics of personal financial situation;
Studying the opinion of the population about the markets for goods, services and savings;
Calculation of private and general indicators of consumer expectations;
Analysis of the characteristics of consumer expectations of certain socio-demographic groups of the population.
The goal also determines the object of statistical observation. The object of statistical observation is a statistical set of units of the phenomenon under study. The concept of qualification is connected with the question of the object of observation. Qualification- values of the feature (features) that limit the object of observation. In the above example, the object of the survey is the population of Russia aged 16 years and older (the boundaries of the population in this case: territory - Russia, age - 16 years and older.)
Unit of observation- this is the primary element of the object of statistical observation, which is the carrier of signs to be registered and the basis of the account maintained during observation. Often the unit of observation is the unit of the studied population.
statistical form- this is the main instrument of observation, namely a form of a certain form (census form, questionnaire, questionnaire, reporting form, etc.). An obligatory element of the statistical form is its title and address parts. In the title part indicate the name of the observation, by whom and when the form was approved, the date of submission of information. In the address - the name of the enterprise, its address or surnames, names and patronymics of the examined persons and their addresses.
The form is accompanied by instructions for filling it out.
Organizational matters preparation of observation :
Choice of monitoring body;
Determination of observation time;
Determination of the place (territory) of the observation;
Tentative lists of surveyed units;
Preparation of statistical tools and its replication;
Estimating the cost of conducting a survey;
Placement and training of personnel, etc.
The choice of the monitoring body is the choice of the performer. Supervision can be carried out in-house or by external organizations.
The issue of the time of observation includes the definition of the period (period) of observation and the critical moment of observation.
Observation period– start and end time of data collection. Usually, the time is chosen when the object under study is in its usual state. For example, the 2010 All-Union Population Census was conducted over 12 days, from 14 to 25 October.
Critical moment of observation- pre-set date and time. All information during the observation is collected as of this particular moment. The critical moment of the All-Union population census in 2010 was 00:00 on October 14. For example, if a child was born at 0:20. October 15, and the counter came to this house on October 18, then this child was not subject to registration. This was done to avoid double counting.
The observation area covers all locations of observation units; its boundaries depend on the definition of the unit of observation.
The most essential stage of the preparatory work is the compilation of the list of surveyed units. This list is necessary both to check the completeness and timeliness of the information received, and to determine the scope of work and calculate the required number of employees for statistical observation.
In order to successfully carry out statistical observation, the preparation of statistical tools (various types of forms, instructions, etc.), their reproduction and timely supply of them to the personnel conducting the observation are of no small importance. Finally, among the most important preparatory measures is the promotion of ongoing statistical work by means of the press, radio, television (explaining the tasks and objectives of the survey).
Primary accounting and reporting. Specially organized statistical observation
There are several forms, types and methods of observation. This allows the researcher to select an observation that matches the goals and objectives provided by the available resources.
Highlight 3 organizational forms statistical observation: reporting and specially organized observation, registers.
Statistical reporting- the main form of state statistical observation, with the help of which the statistical authorities receive from enterprises, (institutions, organizations) the information they need within a certain time frame and according to approved forms.
Reporting is based on primary accounting and is its generalization. Statistical reporting is approved by state statistics bodies and has:
Mandatory nature, i.e. all enterprises, institutions, organizations must submit it within the specified time frame;
Legal force, as it is confirmed by the signature of the head of the enterprise (institution, organization);
Documentary validity, since all data are based on primary accounting documents.
Statistical reporting by frequency is daily, weekly, monthly, quarterly; annual and one-time.
Specially organized statistical observation- this is a form of statistical observation, which is carried out in order to collect information that is not in the reporting or to verify, clarify the reporting data. An example of a specially organized statistical observation can be a population census, all kinds of sociological surveys, censuses of industrial equipment, remnants of materials, etc.
Census- this is a specially organized observation, repeated, as a rule, at regular intervals, in order to obtain data on the number, composition and condition of the object of statistical observation for a number of characteristics. Russian practical statistics conducts censuses of the population, material resources, perennial plantations, construction in progress, etc.
The salient features of the census are:
The simultaneity of its implementation throughout the territory to be covered by the survey;
Unity of the surveillance program;
Registration of all units of observation without exception.
The observation program, techniques and methods of obtaining data should, if possible, remain unchanged. This makes it possible to ensure the comparability of the information collected and the generalizing indicators obtained during the development of census materials.
Population census carried out to obtain information about the population, its distribution throughout the country, age and gender structure, marital status, national composition, level of education, employment, etc.
In Russia, population censuses were conducted in 1897, 1926, 1939, 1959, 1970, 1979, 1989, 2002 and 2010. The census program is constantly expanding, some questions are modified, but the main ones are maintained unchanged in order to study the dynamics of indicators.
The 2010 census was conducted from 14 to 25 October. The unit of observation was the household. Preliminary census results will be available in the second quarter of 2011. The final results of the census will begin to be published from the end of 2011.
Registers is a form of continuous statistical observation of long-term processes that have a fixed beginning, stage of development and a fixed end. It is based on the maintenance of a statistical register. Statistical practice uses population registers and business registers.
Types of statistical observation. Methods of continuous and selective observation of socio-economic phenomena and processes
Depending on the coverage of units of the study population statistical observation is divided into continuous and non-continuous.
Continuous observation covers all units of the population without exception. An example is the All-Union Census of the Population, complete observation of large and medium-sized enterprises.
Discontinuous observation covers only part of the study population. Depending on the method of selecting population units for observation, there are:
Selective observation;
Observation by the method of the main array;
Questionnaire;
Monographic observation.
Selective observation- observation of a part of the population selected at random. When properly organized, it gives fairly reliable results that are quite suitable for characterizing the entire population under study. Selective observation is widely used in various branches of the national economy. In industry - to control the quality of products, in agriculture - when identifying the productivity of livestock, in trade - when studying the degree of satisfaction of the demand of the population, etc.
Observation by the main array method - this is the observation of a part of the units of the population that make the greatest contribution to the phenomenon under study. Typically, the units surveyed are the largest in the population. The idea of the method is that large units of observation determine the bulk of the studied indicators. For example, a few large enterprises can produce the bulk of the industry's output, while a large number of small enterprises produce a small part of it.
Questionnaire observation- data collection based on the principle of voluntary completion of questionnaires (questionnaires) by addressees. As a rule, fewer completed questionnaires are returned than sent out. In addition, it is very difficult to verify the reliability of the collected material. Therefore, this method of observation can be used in cases where high accuracy of information is not required, but approximate characteristics are needed. It is resorted to when conducting sociological surveys, in trade to study the demand of the population for certain goods, etc.
Monographic observation is a detailed description of individual (most often the most typical) units in the statistical population. Before a monographic survey, the goal is not to characterize the entire population. It is aimed at solving the problems of a deeper study of individual units of the population. The monographic method was used in Russia back in the days of zemstvo statistics when surveying peasant farms of various types: prosperous, medium and poor. It is currently used, for example, in ethnographic research.
Non-continuous observation has a number of advantages over continuous observation:
Costs are reduced (cost, material, labor, time);
A more detailed surveillance program may be used;
The reliability of the survey results is increased due to more thorough preparation of the observation and better control of the collected data.
Depending on the time of data recording, continuous (current) and discontinuous observations are distinguished. The latter, in turn, is subdivided into periodic and one-time observation.
Continuous (current) surveillance- this is a systematic observation in which the registration of facts is carried out as they are accomplished. For example, civil registration (birth, marriage, divorce, death). Based on the data of the current observation, statistical reporting and registers are compiled
At discontinuous observation data is captured at a specific point in time. Discontinuous observations are divided into periodic (carried out regularly, at certain intervals of time), or one-time (carried out once or can ever be repeated after an indefinite period of time). An example of periodic monitoring is annual, quarterly, monthly financial statements.
Observation methods
There are three types of observation:
Direct observation;
Documentary observation;
Direct observation- observation, in which data are established and recorded by the recorder by measurement, weighing or counting. An example would be an inventory of medicines in a pharmacy, a census of equipment, etc.
At documentary observation relevant documents serve as a source of information. This is the most accurate method of observation used by enterprises when reporting on the basis of primary accounting documents.
Survey is an observation in which facts are recorded from the words of the interviewee. For example, a survey is used in a population census. In turn, the survey can be organized in different ways. The following main survey methods are used:
Expeditionary (oral);
Self-registration;
Correspondent way;
Yavochny.
At expedition survey the registrars themselves record the facts (fill out the observation form) according to the words of the interviewee. This method provides the most reliable information.
At self-registration fixing the facts (filling out the form) is carried out by the respondent. Counters (registrators) distribute observation forms to the respondents, explain the rules for filling them out, and then collect the completed forms.
At correspondent survey information to the monitoring bodies is reported by the staff of voluntary correspondents. In this way, firms receive information from buyers about their products. This method does not require large expenditures, but it does not provide high quality materials, since it is not always possible to check the accuracy of the reported information directly on the spot.
Yavochny, provides for the submission of information to the bodies conducting monitoring, in person, for example, when registering marriages, births, divorces, etc.
Table 1.1
Classification of forms, types and methods of observation
In table. 1.1 presents the final classification of forms, types and methods of observation.
Errors of statistical observation, their types. Statistical data control
The most important requirement for statistical data is their reliability.
Under accuracy of statistical observation or reliability of observational data the degree of conformity of the values of the signs of the observed phenomena obtained in the course of observation with their actual value is understood. The difference between them is called error (error) of observation.
Allocate errors of registration and errors of representativeness (representativeness ).
Registration errors arise as a result of the incorrect establishment of facts in the process of observation or their incorrect recording. They are divided into random and systematic and can be both with continuous and non-continuous observation.
Random registration errors- these are errors that do not have any direction, for example, various kinds of unintentional typos. With a large volume of the studied population, random registration errors tend to cancel each other out.
Systematic registration errors have a certain direction (the values obtained during the observation are always overestimated or underestimated compared to the true values). They may be intentional or unintentional. Intentional mistakes- deliberate distortion of data. For example: intentional misrepresentation of income in order to reduce the amount of tax; incorrect data on marital status provided in the census - the number of married women always exceeds the number of married men.
Unintentional errors caused by various random reasons. An example of an unintentional systematic error is the error resulting from a measurement by a faulty measuring instrument, if information is collected by direct observation.
Systematic errors lead to serious distortions of the result.
Representativeness (representativeness) errors characteristic only of non-continuous observation. They are also divided into random and systematic errors.
Random representativeness errors are always present. They arise as a result of the fact that not the whole population, but part of it, is subjected to examination. In the theory of statistics, methods have been developed for estimating the magnitude of such errors.
Representativeness biases arise if the principle of selecting units for non-continuous observation is violated.
To improve the accuracy of observation, it is necessary:
Strictly adhere to the chosen research technology;
Questions on the form must be clear and not ambiguous;
Have well trained staff;
Carry out logical and arithmetic control of the collected data.
Arithmetic control is to check the accuracy of the arithmetic calculations used in reporting or completing survey forms.
Logic control is based on a logical relationship between the features and consists in checking the answers by logical comparison or comparison of the data obtained with other sources on the same issue. An example of a logical comparison: the census form indicates that the age of a married woman with a higher education is 7 years.
Control questions
1. What are the requirements for data obtained through statistical observation?
2. Organizational forms of statistical observation and their essence.
3. Specify the main types of statistical observation.
4. What are the types of non-continuous observation.
5. List the main methods of statistical observation.
6. Expand the essence of the program-methodological and organizational issues of the plan of statistical observation.
7. What is called the object of observation and the unit of observation?
8. What is a statistical surveillance program?
9. Give the concept of the reliability of statistical data.
10. What are the types of statistical observation errors?
11. What is the arithmetic and logical control of observation data?
Selection of units in the sample
Types of selective observation: -actually random -mechanical -typical
Proper random selection - each unit from the general population is selected at random.
Mechanical selection - a list is compiled in a certain order (alphabetical, from largest to smallest) and units are selected at a certain interval. Typical selection - the entire population is divided into typical groups, from which selection is carried out.
Sample selection methods: 1) non-repeated - each registered unit is not returned to the general population and cannot be re-examined in the future. 2) re-selection - each registered unit of the sample is again returned to the general population and can be re-selected in the future.
Grouping and grouping intervals. secondary grouping.
With a continuous change in a feature, the number of groups is determined by the values of the feature in the interval.
The interval is called The difference between the maximum and minimum values of a trait in each group. There are 3 types of intervals: 1) equal 2) unequal 3) specialized
Equal intervals are used in cases where the change in the attribute is uniform. Unequal intervals are used when there is an uneven change in the attribute in the lower and higher groups. Specialized intervals are used in cases where qualitatively different groups are distinguished. Secondary grouping is an operation to form new groups based on previous grouping.
Distribution ranks
The result of the summary and grouping of statistical materials yavl. Series of indicators that characterize the phenomenon under study are statistical series. Statistical distribution series is an ordered distribution of units according to some attribute. Depending on the trait, there are attributive and variational distribution series. Attributive called. rows formed by qualitative features. Variational distribution series built on a quantitative basis. The variation series consists of 2 elements: variants and frequencies. Named options. individual values of the attribute that it takes in the variational series. Frequencies are numbers showing how often certain options occur in a distribution series.
There are discrete and interval variation series. A discrete series characterizes the distribution of population units according to a discrete, discontinuous feature. In the interval series, the value of the attribute takes on any quantitative values within certain intervals.
Sectional diagram.
The sectional chart is a relationship between the range of variation (), interquartile spread, defined as the difference between the upper () and lower () quartile and the median, which allows you to graphically represent the distribution of the population under study.

By lining up different section charts side by side, you can immediately get a visual idea of the relationship between central trends and the degree of dispersion. Quartiles represent the value of a feature that divides the ranged population into four equal parts. The lower quartile separates 25% of the population with the lowest values of the attribute, i.e. 25% of the population units will be less than the calculated value. The upper quartile separates 25% of the population with the highest values of the attribute, i.e. 25% of the population units will exceed the value. Thus, the interquartile spread accounts for 50% of the studied population. The middle quartile is the median. The considered indicators can be calculated for both interval and discrete variational series.
Matrix notation
Matrix notation OLS. Let us introduce the notation:

where is the observation vector of dependent variables; is the observation matrix of independent variables; is the number of observations; is the number of independent variables.
The regression model in matrix form can be written as . To determine, we minimize the sum of the squared deviations of the vector from the regression line.
Multicollinearity.
Multicollinearity (for multiple regression) - high correlation of the matrix of pairwise correlation coefficients of independent variables. The resulting regression parameters have large standard errors and checking their significance by Student's t-test does not make sense. Estimates of regression parameters are very sensitive to changes in the sample size and to the results of observations.
Assessment of the adequacy of the model.
For the practical use of regression models, their adequacy is of great importance, i.e. compliance with actual statistics. Analysis of the quality of the empirical pair and multiple linear regression equation begins with the construction of an empirical regression equation, which is the initial stage of econometric analysis. The first, built on a sample, regression equation is very rarely satisfactory for one or another characteristic. Therefore, the next most important assessment is to check the quality of the regression equation. In econometrics, a well-established scheme of such verification is adopted, which is carried out in the following areas:
checking the statistical significance of the coefficients of the regression equation
checking the overall quality of the regression equation
verification of data properties, the feasibility of which was assumed when evaluating the equation (checking the feasibility of the LSM prerequisites)
Checking the adequacy of the entire model, i.e. determination coefficient is carried out using the Fisher criterion. ![]() where is the variance referred to the regression (explained variance); – residual regression.
where is the variance referred to the regression (explained variance); – residual regression.
The rate of growth and growth.
The indicator of the intensity of changes in the level of the series, expressed in fractions of a unit called. growth rate, and as a percentage, the growth rate.
The growth factor shows how many times the comparative level is greater than the level with which the comparison is made. The growth rate is always a positive number.
A negative assessment of the rate of change in the level of the series per unit of time is given by indicators of the growth rate.
The growth rate shows how many percent the compared level is more or less than the level taken as the base.
The growth rate can be positive, negative and equal to zero, expressed as a percentage and fractions of a unit (growth rate)
The growth rate can be obtained from the growth rate, expressed as a percentage, by subtracting 100% from it.
The main indicators of a series of dynamics include:
1) Absolute growth () is defined as the difference between two levels of the dynamic series and shows how much this level of the series exceeds the level taken as the comparison base: a) basic b) chain where - absolute growth; – the level of the compared period; – level of the base period; is the level of the immediately preceding period. 2) Acceleration () is the difference between the absolute change for a given period and the absolute change for the previous period of the same duration. This indicator is calculated by the formula: . The absolute acceleration indicator is used only in the chain version, but not in the basic one. A negative acceleration value indicates a slowdown in growth and an acceleration in the decline in the levels of the series. 3) The growth rate is the ratio of the compared level (later) to the level taken as the base of comparison (earlier). This indicator shows how many percent the compared level is in relation to the level taken as the base, or how many times the compared level is greater than the level taken as the base. The growth rate is calculated by the formulas: a) basic b) chain
4) The growth rate shows how many percent the level of a given period is more (or less) than the base level. The growth rate is calculated by the formulas: a) basic b) chain
Coarse intervals
Coarse intervals from quarterly to annual (total amount), allows you to get a more visual trend in the volume of sales. The meaning of the technique lies in the fact that the initial series of dynamics is transformed and replaced by another one, the indicators of which refer to longer periods of time. For example, a series containing data on quarterly sales of products can be converted to a series of annual data. The newly formed series can contain either absolute values for time intervals enlarged in duration (these values are obtained by simply summing the levels of the original series of absolute values), or average values. When the levels are summed up or when averages over coarsened intervals are identified, the deviations in the levels due to random causes cancel each other out, smooth out, and the effect of the main factors in changing the levels is more clearly detected.
Alignment with LSM
To find unknown coefficients by the least squares method (LSM), one can compose a system of normal equations for the considered functions and solve them by determining the unknown coefficients , and . Consider an example of compiling a system of normal equations for a hyperbolic function. LSM minimizes the sum of squared deviations () of observed values from theoretical ones. Symbolically, this can be written as follows. where are the observed values of the time series; – theoretical values of the time series; – time references, for example, years; – the number of observed values of the time series; are unknown coefficients.
The study of seasonal phenomena
Under seasonal fluctuations is understood as a stable fluctuation of a series of dynamics, repeating at certain periods of time during the year. . After that, we determine the individual seasonality indices according to the formula. Then we find the average values of individual seasonality indices using the formula. where is the number of periods for which individual seasonality indices are calculated. Using the obtained average values of the seasonality indices, the initial series of dynamics is cleared from the seasonal component, obtaining a trend. The theoretical trend values are then determined from the above functions of time. The following model can be used to make a prediction
The concept of an index
The index is a relative value that characterizes the change in the levels of complex socio-economic indicators over time, space or in comparison with the plan. A complex indicator consists of directly incommensurable elements. Index indicators are calculated at the highest level of statistical generalization and are based on the results of summary and processing of statistical observation data. With their help, the following tasks are solved: - Characterization of the overall change in a complex economic indicator and its individual elements; - Measurement of the influence of factors on the overall dynamics of a complex indicator, including a characterization of the influence of a change in the structure of the phenomenon. The index is the result of comparing two indicators of the same name, therefore, when calculating them, they distinguish between the compared level, called the current or reporting level, and the level with which the comparison is made, called the base level.
Index classification
The classification of indices is shown in fig.

The indices of volume indicators include indices of the physical volume of production, the physical volume of trade, the physical volume of national income, etc. Indices of qualitative indicators include indices of prices, cost, labor productivity, etc. General indices characterize the change in the population as a whole, for example, the gross output of the national economy in the reporting year compared to the previous one. Individual indices provide a comparative description of the dynamics of individual elements of the population, for example, the production of pig iron in two periods. Group indices do not characterize the dynamics of the entire population, but only part of it, for example, the index of gross output of the engineering industry. Aggregate and average of individual indicators are determined by the methodology of their calculation. If the base for comparing all levels of the phenomenon remains constant, the resulting index is called the base index, otherwise it is called the chain index.
Index relationship
Indices can be used to analyze the dynamics of socio-economic phenomena over a number of successive periods. In this case, to achieve comparability, they must be calculated according to a single scheme. Such a scheme for calculating indices for several time periods is called an index system.
The main stages of statistical observation. Forms, types and methods of statistical observation.
Statistical observation is a systematic scientifically based collection of data or information about socio-economic phenomena and processes.
The main stages of statistical observation: -preparation of observations; -determination of the purpose and object of observation
Development of a document for data collection - draw up a calendar work plan.
2. carrying out mass data collection (begins with the distribution of questionnaires, forms and ends after filling out, delivery).
3.preparation of data for automated processing (subject to arithmetic and logical control)
4. development of proposals for improving the stat. observations.
The classification of statistical observation can be carried out according to four criteria: form, coverage, time and method of taking into account factors.
Reporting is a form of statistical observation in which enterprises submit the necessary data to the statistical authorities in the prescribed form within a certain period of time, certified by the signatures of persons responsible for the accuracy of the information reported.
According to the duration of the period, periodic and annual reporting can be distinguished. Periodic reporting is provided monthly, quarterly. Annual reporting is presented based on the results of work for the year. Reporting is also divided into external and internal. External reporting is established by state bodies, ministries and departments. Internal reporting is formed in accordance with the accounting policy of the enterprise, the development of which is mandatory in market conditions. Specially organized statistical observation is carried out in the form of censuses and all kinds of surveys.
Continuous observation covers all units of the population without exception (for example, a population census). Non-continuous is a statistical observation in which only a part of the studied population is subject to survey. This part can be chosen in different ways. Therefore, it is subdivided into varieties. The survey of the main array is the observation of a part of the largest units that prevail in the population under study (for example, price dynamics can be examined for the largest cities or markets).
Selective observation provides special methods for selecting and forming the studied part of the population. Monographic observation is a detailed description of individual units of observation in the statistical population. This observation is usually carried out in relation to typical units or characteristic types of phenomena (description of the budget of the family of a worker or unemployed). Continuous (current, constant) is called statistical observation, in which the establishment and examination of facts occurs as they occur (for example, traffic accidents) .Discontinuous is called statistical observation, in which the establishment and examination of facts is carried out intermittently, from time to time. One-time observation is carried out as the need arises for data collection, in the study of a specific phenomenon or process (for example, one-time registration of folk theaters).
Periodic is an observation that is carried out at certain intervals or periods of time. Direct accounting is a statistical observation in which the necessary information is obtained by counting, measuring and weighing units of the population.
Documentary accounting is a statistical observation in which all the necessary information is obtained on the basis of various documentation (for example, customer accounts, birth certificates, etc.). at the interviewee.
2.Methodological and organizational issues of statistical observation. The concept of selective observation.
The programmatic and methodological issues of statistical observation include: - establishing the purpose and objectives of observation - establishing the object and unit of observation - developing an observation program - choosing the type and method of observation
The purpose of statistical observation yavl. obtaining reliable information to identify patterns in the development of phenomena and processes. Stat object observation is a set of social phenomena and processes that are subject to observation. The unit of observation is the primary element of the object of statistical observation. The monitoring program is a list of indicators to be registered. Selective observation is the observation of a part of the units of the studied population with the aim of spreading the data to the entire population. Benefit: Saves time, labor and money. Requirement: sampling sufficiency of at least 10% of the general population.
In order to study mass phenomena and processes of public life, including crime, one should, first of all, collect the necessary information about them - statistical data (information, which is understood as a set of quantitative (digital) characteristics obtained as a result of a statistical study (observation and scientific processing.
State statistical observation is carried out by collecting statistical information from reporting subjects (primary statistical data on the forms of state statistical observation (state statistical reporting) in the form of documented information) in order to speed up consolidated official statistical information on the socio-economic and demographic situation of the country.
Official statistical information is part of the state information resources on the socio-economic and demographic situation of the country.
Mandatory stages of the study: statistical observation, summary and grouping of the collected material, processing and analysis of summary statistical data (information). The last two stages (stages) constitute the scientific processing of statistical data (information).
The listed stages (stages) are inextricably linked, are carried out according to a preliminary plan, and only in their totality constitute the complete form of any statistical study.
Statistical observation is the first stage of a statistical study of any legal or legally significant phenomenon, which is a scientifically organized collection of data on legal and legally significant phenomena and processes by registering established facts in accounting documents for subsequent generalization.
Any statistical research begins, firstly, with obtaining the initial statistical data (for example, taking into account offenses, court decisions or other legally significant facts), and secondly, with the generalization of the established facts into the appropriate totality (the data obtained are reduced for some reason). in various forms of reporting).
The results of the study and the objectivity of conclusions about the phenomenon under study largely depend on the quality of statistical observation and the correct scientific organization. Therefore, a number of requirements are imposed on statistical observation, the main of which is the reliability and mass character of the initial information. The reliability of the data (their correspondence to the actual state of affairs) is determined by a number of reasons: the professionalism of the statistical staff, the monitoring program, the social content of the indicator (for example, deliberate distortion of data on the number of crimes), etc. The mass nature of statistical observation is determined by the fact that in order to obtain objective statistical data, it is necessary to cover a sufficiently large number of facts of the manifestation of the phenomenon or process under study. Statistical observation must necessarily be systematic, since only continuous or regular observation makes it possible to study the trends and patterns of legal processes characterized by quantitative and qualitative changes.
The most important requirement of statistical observation is the comparability of observation units among themselves (for example, it is impossible to compare crime measured in criminal acts (crime facts) and crime measured in crime subjects (persons who committed them), since one crime can be committed by a group of people, and one person can commit several crimes). Comparability of data is achieved by the unity of the methods of registration (accounting) of data, the monitoring program, the timing and time of observation (for example, crimes are registered at the moment a criminal case is initiated, and persons who have committed crimes at the moment the prosecutor approves the indictment).
Any statistical observation includes the following stages: preparatory work, direct collection of mass data, control over their quality, preparation of data for automated processing.
The stage of preparing the observation includes the development of a plan for its implementation, which should contain the solution of program-methodological and organizational issues.
The program and methodological issues include: definition of the goal (task), object, units of observation, totality and measurement; composition of characteristics subject to registration; development of an observation program and documents for data collection, as well as the choice of place and time of observation.
Organizational choice of the type and method of observation, determination of the circle of persons and organizations responsible for conducting observation, selection, training and instruction of personnel, reproduction and distribution of primary accounting documents and statistical reporting forms, setting deadlines for the submission of materials, as well as other practically important issues related to with statistical observation.
The direct collection of mass data is the filling of statistical forms - primary accounting documents (census sheets, statistical cards, questionnaires, forms, etc.) and statistical reporting. It begins with their distribution and ends with delivery after filling in to the bodies (divisions) that conduct monitoring.
The data obtained at the stage of their preparation for automated processing are subjected to a quality check by arithmetic and logical control based on knowledge of the relationship between indicators and qualitative features.
2. Program and methodological issues of organizing statistical observation
Statistical observation is the initial stage of the statistical study of any legal or legally significant phenomenon, and its final results directly depend on its correct scientific organization.
The programmatic and methodological issues of organizing statistical observation include:
Definition of the purpose and tasks of observation:
Establishment of the object and unit of observation;
Drawing up a monitoring program;
The choice of the type and method of observation.
The objectives of statistical observation in legal statistics can be very different. They arise from real socio-legal needs, for example, when studying crime, the goal may be to track the level of recorded crime. At the level of republics, cities, their own specific needs may arise in the study of certain legal phenomena, information about which is collected in addition to nationwide forms of accounting and reporting.
The main goal of any statistical observation is to obtain reliable information about the phenomena and processes under study in order to identify patterns and trends in their development.
The main practical purpose of statistical monitoring in the field of law enforcement is to register and record each detected crime and the persons who committed it in the relevant primary records. To obtain complete data necessary for analysis, the purpose of observation must be formulated clearly and precisely.
Depending on the goal, specific tasks are set that must be solved in the course of statistical observation.
The tasks of statistical observation follow from the tasks of statistical research (depending on the real social and legal needs of law enforcement agencies or the state) and can be very different. When determining the purpose and objectives of statistical observation, it is also necessary to take into account the practical capabilities of those organizations that are entrusted with the statistical observation of legal or legally significant phenomena.
Depending on the purpose of statistical observation, the object of observation is selected.
The object of statistical observation in legal statistics is the totality of social and legal phenomena and processes, facts or events that are subject to observation.
It is necessary to clearly establish the spatial (observation area: district, city, etc.), temporal (observation period: month, year) and quantitative limits of the object of observation; indicate the essential features of the object of observation that distinguish it from other objects (for example, when studying crime, only persons who have committed a crime, and not administrative or other offenses, are subject to registration).
The specific objects of criminal law statistics are: a crime, a person who committed a crime, and punishment, i.e. a measure of state coercion, appointed by a court verdict.
The specific objects of civil law statistics are: a civil law dispute (civil case), parties to a civil process (plaintiff and defendant), and a court decision.
The objects of administrative and legal statistics are: administrative offenses (offences), persons who have committed administrative offenses, measures of administrative responsibility (administrative penalties).
Any object of statistical observation consists of separate elements, therefore, when determining the object of observation, it is necessary to resolve the issue of the unit of observation.
Unit of observation- this is the primary element of the object of statistical observation (the population under study), which is the bearer of legally significant features recorded during observation.
In legal statistics, the units of observation can be a crime, a person who committed a certain crime, a civil case, a plaintiff, etc. The unit of observation should not be identified with the reporting unit.
Reporting unit is the source from which the primary statistical information comes. With regard to criminal law statistics, such sources are police departments, district (city) prosecutor's office, district court, penitentiary institutions.
Unit shows, in what values the socio-legal phenomena studied by statistics are taken into account. In the statistical reporting of criminal justice bodies, three units are used to measure crime: a criminal case (investigative or judicial proceedings>), a crime (by type), a subject of a crime (by person: suspect, accused, defendant, convicted, prisoner). should be taken into account. that the subjects of crimes can be incomparable at different stages of criminal justice: not every suspect becomes an accused, not every accused becomes a defendant.
An important requirement of statistical observation in legal statistics is the comparability of units of measurement.
It is important to distinguish between crime measured in criminal cases, crimes and persons. The number of registered crimes, as a rule, exceeds the number of persons who have committed crimes, since only a part of the persons who have committed crimes are identified in the process of investigative and operational activities, and the statistics of registered crimes also include those for which the persons to be charged as accused turned out to be unidentified. . Several crimes may be combined in one criminal case, one crime may be committed by a group of persons, and one and the same person may commit several crimes.
The program of statistical observation is developed on the basis of the content of the object, the purpose and objectives of statistical observation. The program of statistical observation is drawn up during the organization of any statistical and legal research.
Statistical Surveillance Program is a list of clearly formulated questions to which reliable answers must be obtained for each unit of observation. The content of the program depends on the goals and specifics of the object of study.
For example, when studying the personality of a criminal, the observation program should contain questions about the socio-demographic data of criminals. A properly designed monitoring program and ensuring the reliability of data is the key to a successful statistical study.
It is undesirable to include in the observation program unnecessary questions (answers to which are not required to solve the problems of a particular study), ambiguous questions or questions that may cause mistrust among the subjects being examined (for example, questions about socio-demographic data in an anonymous survey on criminal records may alert the respondent) . Questions should be precise and reflect the essential features that directly characterize the phenomenon under study.
The main monitoring tool is a statistical form (questionnaire, census form, etc.), which reflects the questions of the statistical monitoring program and the answers to them.
There are two types of forms: individual (card) and list.
An individual form is designed to register the characteristics of one unit of observation. An example of an individual form can be a statistical card of primary registration for a detected crime (in form No. 1), filled out by a prosecutor, investigator or interrogating officer immediately after the initiation of a criminal case.
The list form records the data of several units of observation, as, for example, in the list of court cases scheduled for hearing, where each line indicates a separate case. The list forms include a register of crimes, criminal cases and persons who have committed crimes, in which the internal affairs bodies enter data from primary statistical cards.
The statistical form should be easy to fill in, read, encode and, currently, machine-readable. Detailed instructions are drawn up for the statistical forms, which explain the goals and objectives of the observation and provide explanations for filling out the form.
The choice of the survey site depends mainly on the purpose of the survey.
If we are talking about the census of the population of the country, in this case, the observation covers the entire country.
The choice of observation time in criminal law statistics is determined by the unit of observation.
Thus, the system of unified accounting of crimes and persons who committed them is based on the registration of crimes at the time of initiation of a criminal case and persons who committed crimes at the time of approval of the indictment by the prosecutor.