Raster and vector graphics graphic editors. Raster and vector graphics Presentation on the topic of vector and raster graphics
Slide 2
Raster graphics
A raster image is a mosaic of very small elements - pixels. It looks like a sheet of checkered paper, on which each cell (pixel) is painted with a certain color, and as a result of this coloring an image is formed.
Slide 3
Advantages of raster graphics
Effectively presents photographic quality images; Images can be easily printed on a printer Disadvantages of raster graphics Storing raster images requires a large amount of memory; Raster images have limited scaling, rotation, and other transformation capabilities.
Slide 4
Graphic editors are tools that artists use to create and edit images on a computer. Improving the quality of images, as well as editing photographs, are performed in raster graphics editors. Graphic editors, as a rule, allow you to combine the desired color from 256 shades of red, 256 shades of green and 256 shades of blue. Thus, more than 16 million color shades can be obtained on a computer screen.
Slide 5
Graphic file formats
Graphics file format is a way of representing graphic data on external media. BMP PCX GIF TIFF JPEG PSD PCD EPS TGA IMG
Slide 6
BMPWindows Device Independent Bitmap
The format is designed for Windows, so it is supported by almost all applications. Not applicable in publishing. PCX Z-Soft PaintBrush Almost out of use, replaced by GIF and TIFF. Open almost all graphic applications for PC.
Slide 7
GIF(Graphic Interchange Format)
Designed specifically for transmitting images over global networks. It has the most efficient compression method, which is necessary to reduce image transmission time; The new version allows storing multiple images in one file; This feature is most often used on Web pages. The Web browser displays the images in the GIF file sequentially. If each image represents a phase of the animation, then you will see a small cartoon; Almost all raster graphics and desktop publishing editors open; vector graphics editors that support raster objects.
Slide 8
PCD (PhotoCD)
Used in desktop editorial and publishing systems The format is a common way to store a large number of images - especially when publishing all kinds of catalogs. Has the ability to determine the required image resolution when importing. This eliminates the need for time-consuming import of 20-megabyte images with equally time-consuming conversion to a lower resolution.
Slide 9
TIFF(Tagged Image File Format)
A universal format for storing scanned images with color channels (file with TIF extension); Includes compression schemes to reduce file size; Opens most raster graphics editors and desktop publishing systems; vector graphics editors that support raster objects
Slide 10
PSD(Adobe PhotoShop Document)
Internal for Adobe Photoshop; The only format in which all document information is saved, including layers and channels; It is better to save the finished image in other graphic formats for two reasons. Firstly, the PSD file is much larger in size. Secondly, this format is not imported by layout and object graphics programs.
Slide 11
JPEG (Joint Photographic Experts Group)
Designed to save point files with compression; Compression using this method reduces the file size from tenths of a percent to a hundred times (the practical range is from 5 to 15 times), but compression in this format occurs with quality losses (within acceptable limits); The use of this format in printing is not recommended; Open raster graphics editors; vector graphics editors that support raster objects.
Slide 12
EPS (Encapsulated PostScript)
Used in printing It is possible to store vector and bitmap graphics, fonts, rasterized images and rasterization information, clipping paths and calibration curves. TGA (TrueVision Targa) Open raster graphics editors; vector graphics editors that support raster objects. IMG (Digital Research GEM Bitmap) Opens some Windows desktop publishing and graphics editors.
Slide 13
Entering illustrative material
Via scanning Via digital camera
Slide 14
Scanning
Scanning is the conversion of a photographic image on paper or film into electronic (computer) form. To do this, you need to have the scanner itself and programs to work with it (a driver and a scanning program with which you can change scanning settings). The scanner allows you to increase the geometric dimensions of “paper” pictures. You can always perform the reverse conversion (reducing the electronic image after scanning) in a graphics editor. But it will be impossible to increase it without losing quality in the editor. This must be done at the scanning stage.
Slide 15
Resolution Scanning resolution, as opposed to the resolution of the image or print itself, is determined by the number of samples per inch at which the scanner "passes" your image. The rule here is simple: the higher the resolution, the larger the digital file and the larger the print size can be obtained without loss of quality, that is, without pixelation. Therefore, it is extremely important when setting the scanning resolution to take into account what size prints you will need (if you want to print this picture in the future).
Slide 16
Scanning. Problems and solutions. Problem. The image is too bright. The image was scanned with settings that resulted in overexposure. The details in the light areas are lost, and the mid-light areas are too light. Solution. Repeat scanning with a lower exposure (reduce Brightness). Problem. The digital file lacks detail in areas of the image that are in shadow. No matter what you do, these details cannot be restored using an editing program (such as Adobe PhotoShop). Solution. Repeat the scan, changing the shadow settings or overall exposure so that these areas become lighter (increase the brightness). Problem. The digital image is sluggish and the dynamic range is clearly insufficient. Solution. You must either scan the image again at a higher contrast setting, or use the Contrast or Levels commands in your Adobe PhotoShop program.
Slide 17
You can scan anything, as long as the item does not scratch the scanner glass
To use presentation previews, create a Google account and log in to it: https://accounts.google.com
Slide captions:
Raster and vector graphics Lesson topic:
EXAMPLES: RASTER VECTOR Scanned photos Images Pictures Drawings Autoshapes Flowcharts Drawings Objects Word Art WordArt
COMPOSITION: RASTER VECTOR Consists of pixels, for each of which you can set a color. It consists of graphic primitives, for each of which the coordinates of anchor points are specified, as well as the color, thickness and style of the line. X 1 ,Y 1 X 2 ,Y 2 X 1 ,Y 1 X 2 ,Y 2 X,Y R X,Y
FORMATION: RASTER VECTOR When scanning When using digital photo and video cameras When watching TV programs on a computer Using raster graphic editors Using vector graphic editors Using converters in the process of converting raster images into vector drawings
Paint gallery
IMAGE QUALITY: RASTER VECTOR You can create an image that is close to artistic (real). There is always a clear boundary of the object, which gives the image an artificial appearance.
EDITING: RASTER VECTOR Individual pixels or selected fragments. Each object separately.
SCAling: RASTER VECTOR When scaling, the image quality deteriorates (step effect). When scaling, the quality is not lost.
MEMORY SIZE: RASTER VECTOR A drawing takes up a lot of memory, since the color of each pixel is encoded in 2-3 bytes. The image takes up significantly less memory, since only the type of object and its parameters are encoded.
FILE FORMATS: RASTER VECTOR BMR TIFF GIF JPEG PSD PNG WMF SXD FRM CDR EPS CMX BMP WMF JPEG PNG PSD GIF TIFF CDR SXD FRM EPS
Graphic editor is an application program designed for creating and editing graphic images.
GRAPHICS EDITORS: RASTER VECTOR Paint Adobe Photoshop Corel Photo- Paint Photo Finish Micrografx Picture Open Office Image Gimp Portable Corel Draw Adobe Illustrator Micrografx Designer Microsoft Draw Open Office Draw Compass 3-D
Complete the task: Task 1.9 (p. 24) Match each drawing to a type of computer graphics
Homework: §1.2 Prepare for the “Computer Graphics” test
On the topic: methodological developments, presentations and notes
Raster and vector graphics
Subject: Informatics and ICTClass: 7 Program: N.D. Ugrinovich, 2008 Textbook: “Informatics and ICT. 7th grade" N.D. Ugrinovich – BINOM. Knowledge Laboratory, 2007....


 Back forward
Attention! Slide previews are for informational purposes only and may not represent all the features of the presentation. If you are interested in this work, please download the full version.
Duration: 1 lesson, 45 minutes.
Grade: 8th grade.
Technologies:
- computers with MS Windows OS;
- graphic editor Paint;
- projector;
- screen (interactive whiteboard);
Lesson summary.
Lesson objectives:
- Educational – to form concepts about raster and vector graphics, raster graphics editor; develop the ability to create and edit raster graphics.
- Developmental – continue the development of cognitive mental and emotional-volitional processes: attention, memory, imagination.
- Educational – attentiveness, accuracy, interest in the subject.
Lesson type: lesson in the formation of new knowledge and skills.
Teaching methods according to the nature of cognitive activity:
- Explanatory and illustrative.
- Reproductive.
Lesson equipment:
- computers with MS Windows OS;
- graphic editor Paint;
- projector;
- screen (interactive whiteboard);
- presentation “Computer graphics”;
- textbook – Computer Science and ICT. Textbook for grades 8–9. Makarova.
- cards with tests (or a testing program with automatic checking of student answers, for example);
- a program for demonstrating teacher activities on student screens (for example, NetOp School).
Basic concepts:
- raster;
- raster graphics;
- pixel;
- Color palette;
- Vector graphics;
- graphic primitives;
- graphics editor.
Lesson plan:
- Organizing time.
- Updating students' background knowledge and practical experience.
- Motivation for learning activities.
- Learning new material.
- Consolidation of new material.
- Primary control of the results of educational activities.
- Homework assignment.
- Summing up the lesson. Reflection.
During the classes
1. Organizational moment.
Greeting students. (Slide 1)
2. Updating the basic knowledge and practical experience of students.
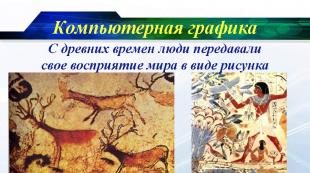
(Slide 2) Since ancient times, people have sought to convey their perception of the world in the form of a drawing, a painting. Guys, pay attention to the board (images of rock art and paintings by artists appear on the board). (Slide 3) The first skill acquired by a person in his life is the ability to draw. From early childhood, people draw on paper, on the asphalt in the yard, on the blackboard at school, on canvas.
(Slide 4) Computers have been part of our lives for quite some time now. They changed the world and human capabilities, and recently those who want to draw are increasingly attracted to the computer. Images created on a computer are shown dynamically or statically. (Slide 5) The advantage of computer graphics is the ability to see how the image is formed at all stages and make unlimited adjustments. (Slide 6)
3. Motivation for learning activities.
(Slide 7) A true designer is unthinkable without an artistic education; he must have excellent command of the techniques of drawing (pencil, charcoal), graphics (watercolor, gouache, pencil, ink, etc.), painting (gouache, watercolor, tempera, acrylic, oil). Is it possible in the modern world, using a computer, knowledge and skills to work with a computer, to become an artist or designer without having any special talent? ( Student answers.)
A computer in the hands of an ordinary person can turn into an obedient instrument for the embodiment of his artistic idea - the very one that he cannot translate on paper.
(Slide 8)
What wonderful opportunities a modern computer provides us with, but what happened before?
(Slide 9)
The first computers worked with numerical and symbolic data and did not have separate means for working with graphics, but were already used to obtain and process images.
(Slide 10)
By programming the memory of the first electronic machines, built on the basis of lamps, it was possible to obtain patterns. The emergence of computer technology posed the problem of image transmission.
(Slide 11)(Slide 12) Today in the lesson we will get acquainted with two types of graphic images: raster and vector. Also in this lesson we will learn how to create and edit a raster graphic image. So, guys, open your notebooks, write down the date and topic of the lesson: “Raster and vector graphics. Raster graphics editor.” (Students write down the topic of the lesson in their notebooks.)
4. Studying new material.
(Slide 13) Raster graphic images are formed in the process of scanning existing drawings and photographs on paper or film, as well as when using digital photo and video cameras. You can create a raster graphic image directly on your computer using a graphics editor.
(Slide 14) A raster image is created using dots of different colors (pixels), which form rows and columns. The collection of dotted lines forms graphic grid or raster
Each pixel can take on any color from palettes, containing tens of thousands or even tens of millions of colors, so raster images provide high accuracy in transmitting colors and halftones.
(Slide 15)
Guys, what do you think, if you increase the number of image pixels, what can be said about the clarity of the image? (If you increase the number of image dots, the image clarity will increase and the image will become clearer.)
Guys, what do you think, if you increase the size of the image pixels, what then can be said about the clarity of the image? (If you increase the size of the image pixels, the image will become less clear.)
(Slide 16) Raster images are very sensitive to enlargement or reduction (scaling). When a raster image is reduced, several adjacent dots are converted into one, so the clarity of fine details of the image is lost. As it increases, the size of each dot increases and a step effect appears, which can be seen with the naked eye.
(Slide No. 17) Unlike raster images, vector graphic images are used to store high-precision graphic objects (drawings, diagrams), for which it is important to maintain clear and bright contours .
(Slide 18) (Slide 19) (Slide 20)
Vector images are formed from elements - point, line, circle, rectangle, etc. For each element, coordinates and color are specified.
What two coordinates define a point on a plane? (Dot specified by its coordinates (X, Y).)
Guys, if a circle is depicted on a plane, what coordinates determine the center of this circle? (Circle specified by center coordinates (X, Y) and radius R.)
The line is specified by the coordinates of the beginning (X 1, Y 1). And what coordinates are the end of this line? (End coordinates (X 2 , Y 2).)
The rectangle is defined by the coordinates of the vertices located along the diagonal: (X 1, Y 1) and (X 2, Y 2).
Vector image elements are called graphic primitives.
(Slide 21) The advantage of vector graphics is that vector graphics can be enlarged or reduced without loss of quality. This is possible because the image is enlarged and reduced according to the formula.
(Slide 22) Guys, what type of graphic image (raster or vector) will you use:
1) To design a logo for our school, given that it will have to be printed on small business cards and large posters? (In this case, it is advisable to use a vector image type.)
2) For digital photo editing. (In this case, it is advisable to use a raster image type.)
Nowadays, software developers create programs that help users work with graphic images.
(Slide 23) To process images on a computer, special programs are used - graphic editors. Graphic editors can be used to view and edit ready-made images, as well as to create drawings and drawings using a mouse or graphics tablet.
So, let's write down the definition: Graphics editor - is a program for creating, editing and viewing graphic images.
Our task in this lesson is to create a raster graphic image.
(Slide 24) Raster graphic editors are the best means of processing digital photographs and scanned images, as they allow you to improve their quality by changing color palette images and even the colors of each pixel. You can increase the brightness and contrast of old and low-quality photographs, remove minor image defects (such as scratches), convert a black and white image to color, and so on.
(Slide 25) In addition, raster graphics editors can be used for artistic creativity by using various image transformation effects. An ordinary photograph can be turned into a mosaic panel, a pencil or charcoal drawing, a relief image, and so on.
(Slide 26) Among raster graphic editors there are simple ones, for example - Paint – standard operating system application Windows, Paint.Net– replacement for standard GR Paint, StarOffice Image– component of an integrated office application StarOffice, as well as powerful professional graphics systems, such as Adobe Photoshop.
Today in the lesson we will work with the raster graphics editor Paint.
To launch GR Paint you need to perform the following sequence of actions:
START – Programs – Accessories – Paint
. You can also launch the Paint graphics editor by double-clicking on the graphics editor shortcut.
(Slide 27)
Let us examine in detail the structure of the Paint program window.
Paint editor window structure

Rice. 1
5. Consolidation of new material.
Guys, I suggest you take your seats at the computers to do practical work. Open the textbook on page 120, find practical work No. 8.
Let’s read the title and purpose of the work (I suggest it to one of the students).
(Editing images in the Paint raster editor. Purpose of work: learn how to create and edit raster graphic images.)
In practical work we need to complete the following tasks:
Create a copy of the Windows operating system desktop screen and edit the resulting raster graphic image:
- place a circle drawn in blue and filled with pale blue in the center of the image;
- draw a Russian flag inside the circle;
- place the inscription “Desktop” on the drawing.
Guys, we will work as follows: I will show you how to perform each action, and you carefully look at your monitor screen and repeat after me. So, let’s complete the first task of practical work, i.e. We will get an image of the Desktop and load it into the graphic editor (using the NetOp School program I show the completion of the first task and invite students to repeat).
- Place a copy of the screen on the clipboard at the moment when the Desktop is loaded, to do this, press the key (Print Screen).
- Launch the Paint editor with the command [ Start-Programs-Accessories-Paint].
- Load images from the clipboard into the Paint editor with the command [ Edit-Paste].
A desktop image containing icons will appear in the editor window.
Guys, follow these steps.

Rice. 2
Let's complete the following task: draw a circle.
4. With Palettes Set the foreground color to blue and the background color to light blue. To do this, left-click on the blue color in the palette - select the main color, and to select the background color, right-click on the pale blue color in the palette. Select a tool from the toolbar Ellipse , in the additional panel that appears – shaded. Draw a circle while holding down the key (Shift). Repeat on your computers.

Rice. 3
Let's complete the following task: draw a Russian flag.
5. Consistently draw using the tool Rectangle three equal-sized filled rectangles (white, blue and red), whose main color and background color are the same. Repeat on your computers.

Rice. 4
Let’s create the inscription “Desktop” at the top of the image.
6. Select a tool Inscription , use the mouse to create a text area and enter text.
Text formatting can be done by calling the text attributes panel using the command [ View-Text Attributes Panel] or context menu. The result of editing will be this image. Repeat on your computers.

Rice. 5
6. Primary control of the results of educational activities.
I suggest you complete a test task on today's topic using the Cognition test shell. (After the students complete the test, I display the results of the test tasks completed by the students and conduct an initial analysis of the test results).
Test.
Computer graphics.
1. A raster graphic image is formed from...
2. A vector graphic image is formed from...
a) points of different colors - pixels;
b) elements - point, line, circle, rectangle, etc. (graphic primitives).
3. What type of graphics will you use to develop a diagram, drawing, school logo?
a) Raster graphics;
b) Vector graphics.
4. What type of graphics will you use to edit your digital photo?
a) Raster graphics;
b) Vector graphics.
5. The program for creating, editing and viewing graphic images is called...
a) Text editor;
b) Graphic editor;
c) Table editor.
(Slide 28) Fill out the table by answering the following questions:
- Where are raster and vector graphics used?
- How are raster and vector images formed?
- What changes happen to images when they are scaled?
| Raster graphics | Vector graphics |
8. Summing up the lesson. Reflection.
- What new have you learned?
- What did you like and what difficulties did you experience while working with the graphics editor?
- Where can you apply what you have learned?
(Students answer questions and draw the following conclusions: Today in the lesson we learned that there are two types of computer graphics: raster and vector. We learned that there are special programs for creating and editing graphic images, and also learned how to create and edit raster graphic images. We liked it today... We experienced difficulties in... The knowledge gained can be applied....)
Raster and vector graphics
Completed by a computer science teacher
MBOU secondary school in the village of Starobazanovo Valitova Valentina Nikolaevna

Computer images
Vector
Raster

RASTER GRAPHICS
- A raster image is stored using dots of different colors (pixels) that form rows and columns.

Raster graphics
- Pixel – the minimum area of the image that can be independently assigned a color
Pixel

The quality of a raster image depends on:
1. Image size
2. Number of colors in the image

- Large volume
- Large volume
- Zoom Sensitivity
Disadvantages of a raster image:

Task: determine the information volume of the image
- Determining the number of colors n in the image. In this case the image is black and white, so n=2
- Determining the number of pixels k in the image. k= 7 x 8 = 56 pixels.

VECTOR GRAPHICS
- Vector images are formed from graphic primitives (points, straight lines, circles, rectangles, etc.)
- In this case, the position of the arrow is described by the coordinates of the beginning and end of its constituent lines and mathematical equations

- Small volume
- Small volume
- Scaling without loss of quality
Advantages of a vector image:

Graphic editor
- Graphics editor is a program for creating, editing and viewing graphic images
- Photoshop Paint
- Photoshop
- Paint
- CorelDraw Macromedia Flash MX
- CorelDraw
- Macromedia Flash MX
Raster editors
Vector editors

Graphic file formats
Method of storing information
Scope of application
Raster
Raster
To exchange data with other applications
In publishing systems
Raster
For storing images with a small number of colors
Raster
For storing photographs and illustrations
Vector
For images created in CorelDraw

RESULT OF THE LESSON
- I know what it is:
- Raster graphics; Pixel; Vector graphics; Graphic editor Graphic file formats.
- Raster graphics;
- Pixel;
- Vector graphics;
- Graphics editor
- Graphic file formats.
- I can:
- determine the information volume of a raster image.
HOMEWORK
- Determine the information volume of a raster image measuring 1024 x 768 pixels and consisting of 64 colors